How to predict by coordinate

Input the genomic coordinates of your region of interest, using hg38 as the reference genome. This input is the most flexible, and is unconstrained by sequencing coverage or any annotation. Be sure to double-check that the output sequence matches your expected region, and check that the output coverage of A/C bases is above the recommended 70%, which is reflective of DMS-modifiable bases meeting all coverage and quality filters.

For most users, only one set of coordinates will be used to define their region of interest. However, two sets of coordinates may be needed when joining two separate regions together, such as when crossing a splice junction.

When analyzing a region within a larger transcript, it is generally recommended to test “buffer” regions, where the region of interest should be extended by 20-50 nt on each end in order to reduce the likelihood of structures being arbitrarily interrupted by the region borders.

Due to computational and server constraints, users will be limited to a maximum input length of 500 nucleotides and a maximum output of 5 predicted structures, though some regions may yield fewer than that. If this does not suit your needs, consider downloading and running the data and code locally (see Download ).
Predict by Gene


Advanced Options
Chromosomal Coordinates (max 500bp)
Coords 1  
Additional Coordinates
Coords 2 Optional
Coords 3 Optional
Coords 4 Optional


IDS
ENST00000340855 (-) ENSG00000010404 (-)

Visualize entire gene
100
150
300
500
+
-
Predict

  Region Local Coords Chrom Coords Length R N Gini Action
1
5'UTR 1-119 149505188-149505306 119 0.8395 50 0.51
2
5'UTR,CDS 120-212 149505095-149505187 93 0.7453 50 0.41
3
CDS 218-308 149504258-149504293 / 149505035-149505089 91 0.7711 50 0.37
4
CDS 311-405 149504161-149504255 95 0.6879 50 0.34
5
CDS 407-492 149503407-149503489 / 149504157-149504159 86 0.5835 50 0.28
6
CDS 493-592 149501033-149501037 / 149503312-149503406 100 0.7019 50 0.38
7
CDS 594-685 149498299-149498307 / 149500949-149501031 92 0.8232 50 0.36
8
CDS 689-783 149498201-149498295 95 0.7563 50 0.31
9
CDS 784-873 149498111-149498200 90 0.6648 50 0.31
10
CDS 874-962 149496432-149496516 / 149498107-149498110 89 0.5867 50 0.32
11
CDS 963-1055 149490434-149490440 / 149496346-149496431 93 0.7542 50 0.41
12
CDS 1057-1158 149490331-149490432 102 0.8250 50 0.37
13
CDS 1159-1269 149487005-149487098 / 149490314-149490330 111 0.8714 50 0.42
14
CDS 1272-1367 149483201-149483218 / 149486925-149487002 96 0.5897 50 0.29
15
CDS 1374-1479 149483089-149483194 106 0.6973 50 0.37
16
CDS 1480-1578 149482990-149483088 99 0.7725 50 0.41
17
CDS 1579-1667 149482901-149482989 89 0.8166 50 0.39
18
CDS 1668-1785 149482783-149482900 118 0.6113 50 0.28
19
CDS,3'UTR 1786-1912 149482656-149482782 127 0.6524 50 0.34
20
3'UTR 1913-2010 149482558-149482655 98 0.7999 50 0.33
21
3'UTR 2011-2109 149482459-149482557 99 0.5286 50 0.28
22
3'UTR 2110-2188 149482380-149482458 79 0.5514 50 0.26
23
3'UTR 2196-2292 149482276-149482372 97 0.6082 50 0.37
24
3'UTR 2293-2383 149482185-149482275 91 0.5397 50 0.37
25
3'UTR 2384-2481 149482087-149482184 98 0.4632 50 0.30
26
3'UTR 2482-2584 149481984-149482086 103 0.6139 50 0.25
27
3'UTR 2588-2679 149481889-149481980 92 0.6066 50 0.30
28
3'UTR 2681-2787 149481781-149481887 107 0.5252 50 0.31
29
3'UTR 2790-2895 149481673-149481778 106 0.3185 50 0.28
30
3'UTR 2901-2998 149481570-149481667 98 0.3815 50 0.32
31
3'UTR 2999-3106 149481462-149481569 108 0.5959 50 0.38
32
3'UTR 3113-3199 149481369-149481455 87 0.6636 50 0.42
33
3'UTR 3200-3298 149481270-149481368 99 0.4876 50 0.30
34
3'UTR 3300-3429 149481139-149481268 130 0.7224 50 0.31
35
3'UTR 3430-3541 149481027-149481138 112 0.6284 50 0.30
36
3'UTR 3542-3639 149480929-149481026 98 0.6682 50 0.33
37
3'UTR 3643-3748 149480820-149480925 106 0.3254 50 0.33
38
3'UTR 3749-3851 149480717-149480819 103 0.6405 50 0.41
39
3'UTR 3852-3951 149480617-149480716 100 0.5324 50 0.44
40
3'UTR 3953-4050 149480518-149480615 98 0.6966 50 0.41
41
3'UTR 4051-4175 149480393-149480517 125 0.7462 50 0.33
42
3'UTR 4178-4272 149480296-149480390 95 0.8824 50 0.46
43
3'UTR 4273-4361 149480207-149480295 89 0.8273 50 0.50
44
3'UTR 4362-4457 149480111-149480206 96 0.7246 50 0.41
45
3'UTR 4462-4546 149480022-149480106 85 0.7569 50 0.52
46
3'UTR 4547-4659 149479909-149480021 113 0.4580 50 0.36
47
3'UTR 4667-4763 149479805-149479901 97 0.6964 50 0.36
48
3'UTR 4764-4902 149479666-149479804 139 0.6559 50 0.40
49
3'UTR 4904-5082 149479486-149479664 179 0.4587 72 0.38
Download CSV

Custom Gene Windows

No custom gene windows have been created yet.
Gene Window Instructions/Interpretation
  1. Search for a gene by name. For each gene, only the canonical transcript (as defined by UCSC in GRCh38.106) is shown. Some gene names may correspond to multiple genomic locations.
  2. For the selected gene, a scatterplot showing the Gini indices, where a high Gini index corresponds to a highly-structured region, for small windows within the transcript. For small RNAs, these windows are sized 20 valid (coverage- and quality-filtered) A/C data points; for all other transcripts, these windows are sized 50 valid A/C data points, due to the ability of DMS to modify primarily A/C bases. In regions with sufficient coverage, these windows correspond to actual transcript lengths of roughly 40 and 100 nucleotides, respectively.
  3. Select a window of interest, either from the scatter plot or from the table below. Generally, windows with a high Gini will yield better results, where the DMS signal aligns more accurately with the predicted base-pais. Windows with high Gini indices relative to the rest of the transcript can also be used to find functional structural elements (ex: TFRC iron response elements).
  4. If previously-defined windows do not suit your needs, you can define a custom window either using (1) the slider below the scatterplot, which shows both a heatmap of previously-defined windows as well as the locations of each UTR and CDS; or (2) custom coordinate-based entry via Predict by Coordinates.
See About for more information on the dataset and for best practices in structure determination.

completed
12
IDS

Aoi: Chr: Coords Strand:
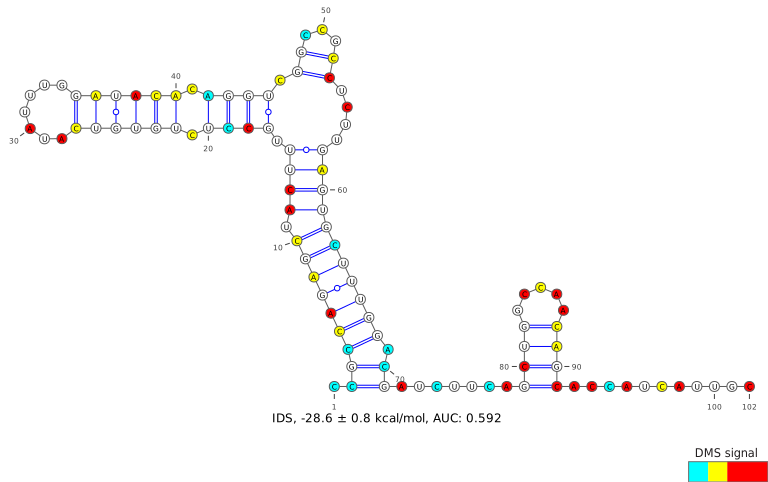
IDS X 149490331 - 149490432 -


  • Annotation Based on canonical annotations, the following gene is in your area of interest: IDS(-)
  • Length Length of region: 102 nt.
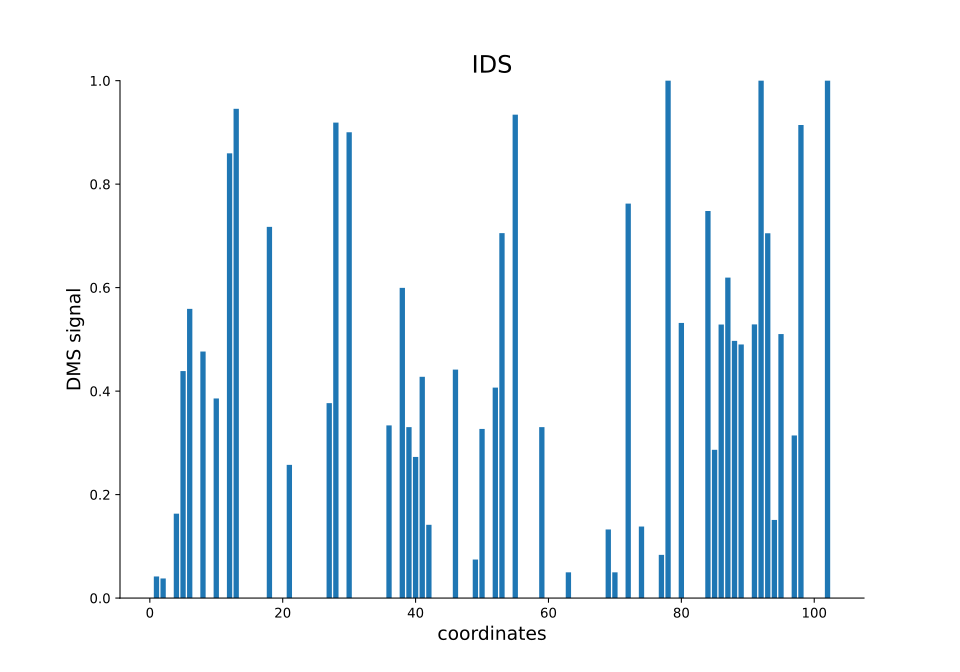
  • Coverage 100.0% of the region's A/C bases included in the filtered DMS dataset. Ideally, this number should be as high as possible for an experimenally-accurate prediction, and over 70% is recommended.
  • Structures This region has 1 maximum predicted structures. 5 is the maximum structures visible on this site. For up to 20 predictions per region, download and run the code locally.
production / 6840c0a13a / 2026-05-28 16:10