How to predict by coordinate

Input the genomic coordinates of your region of interest, using hg38 as the reference genome. This input is the most flexible, and is unconstrained by sequencing coverage or any annotation. Be sure to double-check that the output sequence matches your expected region, and check that the output coverage of A/C bases is above the recommended 70%, which is reflective of DMS-modifiable bases meeting all coverage and quality filters.

For most users, only one set of coordinates will be used to define their region of interest. However, two sets of coordinates may be needed when joining two separate regions together, such as when crossing a splice junction.

When analyzing a region within a larger transcript, it is generally recommended to test “buffer” regions, where the region of interest should be extended by 20-50 nt on each end in order to reduce the likelihood of structures being arbitrarily interrupted by the region borders.

Due to computational and server constraints, users will be limited to a maximum input length of 500 nucleotides and a maximum output of 5 predicted structures, though some regions may yield fewer than that. If this does not suit your needs, consider downloading and running the data and code locally (see Download ).
Predict by Gene


Advanced Options
Chromosomal Coordinates (max 500bp)
Coords 1  
Additional Coordinates
Coords 2 Optional
Coords 3 Optional
Coords 4 Optional


KPNB1
ENST00000583648 (+) ENSG00000108424 (+)

Visualize entire gene
100
150
300
500
+
-
Predict

  Region Local Coords Chrom Coords Length R N Gini Action
1
5'UTR,CDS 386-475 47650180-47650269 90 0.7740 50 0.28
2
CDS 476-585 47650270-47650284 / 47650386-47650444 / 47652694-47652729 110 0.9319 50 0.30
3
CDS 586-672 47652730-47652816 87 0.8021 50 0.18
4
CDS 673-776 47652817-47652876 / 47656860-47656903 104 0.7646 50 0.17
5
CDS 777-871 47656904-47656998 95 0.8499 50 0.21
6
CDS 872-956 47656999-47657060 / 47658508-47658530 85 0.8814 50 0.21
7
CDS 957-1049 47658531-47658623 93 0.8561 50 0.17
8
CDS 1050-1149 47658624-47658660 / 47661119-47661178 / 47663089-47663091 100 0.9670 50 0.33
9
CDS 1150-1255 47663092-47663178 / 47664159-47664177 106 0.8559 50 0.17
10
CDS 1256-1366 47664178-47664269 / 47665057-47665075 111 0.8916 50 0.17
11
CDS 1367-1446 47665076-47665155 80 0.9725 50 0.22
12
CDS 1447-1544 47665156-47665158 / 47668186-47668280 98 0.9219 50 0.23
13
CDS 1545-1643 47668281-47668379 99 0.8915 50 0.20
14
CDS 1645-1729 47668381-47668410 / 47669678-47669732 85 0.8926 50 0.21
15
CDS 1730-1841 47669733-47669844 112 0.8545 50 0.24
16
CDS 1842-1955 47669845-47669869 / 47670702-47670790 114 0.8786 50 0.27
17
CDS 1956-2042 47670791-47670832 / 47673018-47673062 87 0.8575 50 0.22
18
CDS 2044-2144 47673064-47673164 101 0.8646 50 0.22
19
CDS 2147-2237 47673491-47673561 / 47674638-47674657 91 0.8658 50 0.19
20
CDS 2238-2350 47674658-47674770 113 0.9412 50 0.24
21
CDS 2351-2477 47674771-47674782 / 47676409-47676491 / 47677020-47677051 127 0.9230 50 0.22
22
CDS 2478-2582 47677052-47677127 / 47678046-47678074 105 0.9403 50 0.22
23
CDS 2584-2695 47678076-47678187 112 0.9357 50 0.24
24
CDS 2696-2801 47678188-47678189 / 47678308-47678411 106 0.9376 50 0.18
25
CDS 2802-2913 47678412-47678413 / 47680020-47680129 112 0.9929 50 0.22
26
CDS 2914-3018 47680130-47680134 / 47680508-47680607 105 0.9269 50 0.17
27
CDS,3'UTR 3019-3102 47680608-47680669 / 47682404-47682425 84 0.9184 50 0.20
28
3'UTR 3103-3212 47682426-47682535 110 0.9649 50 0.32
29
3'UTR 3213-3289 47682536-47682612 77 0.9416 50 0.35
30
3'UTR 3290-3369 47682613-47682692 80 0.9354 50 0.33
31
3'UTR 3370-3506 47682693-47682829 137 0.9617 50 0.34
32
3'UTR 3511-3618 47682834-47682941 108 0.9749 50 0.43
33
3'UTR 3621-3730 47682944-47683053 110 0.8947 50 0.28
34
3'UTR 3731-3812 47683054-47683135 82 0.8779 50 0.58
35
3'UTR 3813-3953 47683136-47683276 141 0.8859 50 0.35
36
3'UTR 3954-4055 47683277-47683378 102 0.8669 50 0.23
37
3'UTR 4056-4118 47683379-47683441 63 0.9248 50 0.28
38
3'UTR 4120-4204 47683443-47683527 85 0.8624 50 0.25
39
3'UTR 4206-4283 47683529-47683606 78 0.8478 50 0.23
40
3'UTR 4284-4386 47683607-47683709 103 0.4070 50 0.34
41
3'UTR 4387-4510 47683710-47683833 124 0.6530 50 0.48
42
3'UTR 4511-4617 47683834-47683940 107 0.5204 50 0.43
43
3'UTR 4618-4746 47683941-47684069 129 0.5805 50 0.35
44
3'UTR 4747-4831 47684070-47684154 85 0.6249 50 0.43
45
3'UTR 4832-5159 47684155-47684482 328 0.4364 50 0.44
46
3'UTR 5161-5284 47684484-47684607 124 0.4549 47 0.44
Download CSV

Custom Gene Windows

No custom gene windows have been created yet.
Gene Window Instructions/Interpretation
  1. Search for a gene by name. For each gene, only the canonical transcript (as defined by UCSC in GRCh38.106) is shown. Some gene names may correspond to multiple genomic locations.
  2. For the selected gene, a scatterplot showing the Gini indices, where a high Gini index corresponds to a highly-structured region, for small windows within the transcript. For small RNAs, these windows are sized 20 valid (coverage- and quality-filtered) A/C data points; for all other transcripts, these windows are sized 50 valid A/C data points, due to the ability of DMS to modify primarily A/C bases. In regions with sufficient coverage, these windows correspond to actual transcript lengths of roughly 40 and 100 nucleotides, respectively.
  3. Select a window of interest, either from the scatter plot or from the table below. Generally, windows with a high Gini will yield better results, where the DMS signal aligns more accurately with the predicted base-pais. Windows with high Gini indices relative to the rest of the transcript can also be used to find functional structural elements (ex: TFRC iron response elements).
  4. If previously-defined windows do not suit your needs, you can define a custom window either using (1) the slider below the scatterplot, which shows both a heatmap of previously-defined windows as well as the locations of each UTR and CDS; or (2) custom coordinate-based entry via Predict by Coordinates.
See About for more information on the dataset and for best practices in structure determination.

completed
32
KPNB1

Aoi: Chr: Coords Strand:
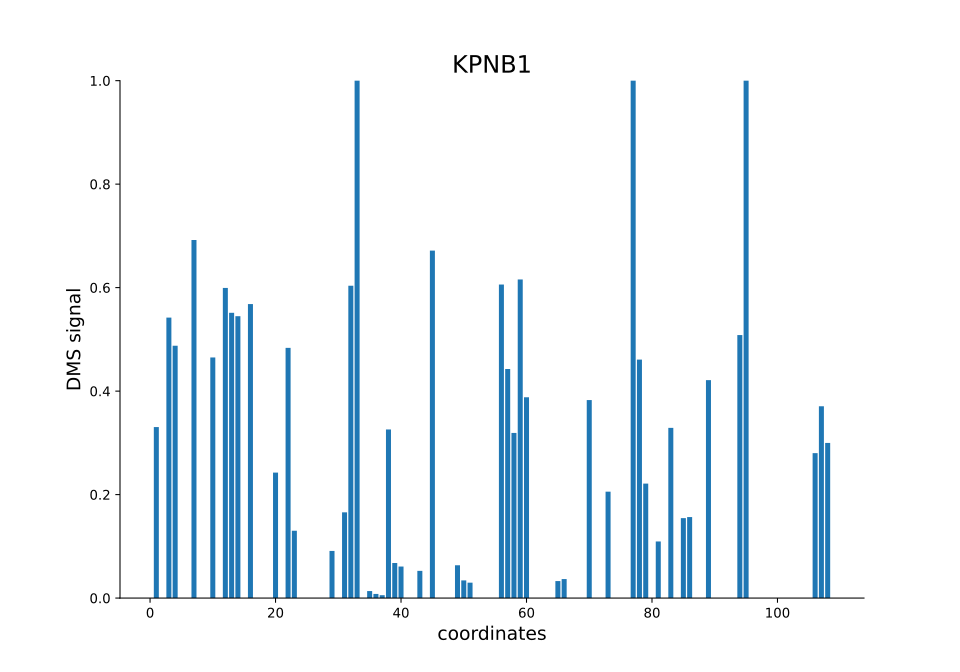
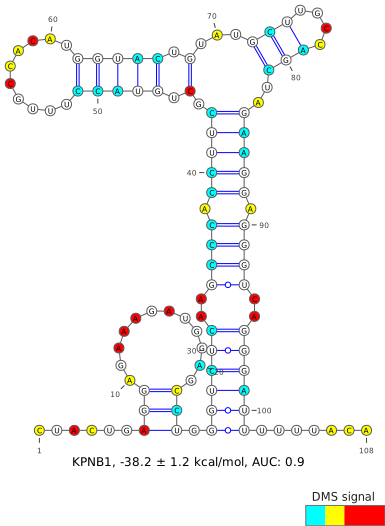
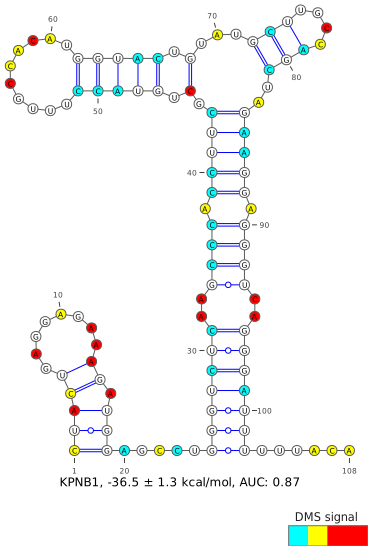
KPNB1 17 47682834 - 47682941 +


  • Annotation Based on canonical annotations, the following gene is in your area of interest: KPNB1(+)
  • Length Length of region: 108 nt.
  • Coverage 100.0% of the region's A/C bases included in the filtered DMS dataset. Ideally, this number should be as high as possible for an experimenally-accurate prediction, and over 70% is recommended.
  • Structures This region has 2 maximum predicted structures. 5 is the maximum structures visible on this site. For up to 20 predictions per region, download and run the code locally.
production / 6840c0a13a / 2026-05-28 17:22